Predicting Daily COVID-19 Cases in British Columbia with Regression and Time Series Models
Key Highlights
Here’s a quick summary of the models I explored and what the results showed:
-
I developed two main models to predict daily COVID-19 cases:
- A regression model that combined previous case counts, a 7-day weighted moving average, and an adjusted wastewater variable.
- A transfer function time series model (a type of ARIMA) that primarily used past case counts and active cases.
-
Some strong predictors emerged:
- The number of active cases from the previous day had a very strong correlation (~0.92) with new cases.
- Adjusted wastewater data showed a strong correlation (~0.8) with new cases, suggesting it captures unreported infections.
-
In terms of performance:
- The time series model was slightly more accurate, achieving a lower RMSE (84.99) but was sensitive to noise and didn’t include wastewater data.
- The regression model was a bit less accurate (RMSE 86.24) but was more robust and successfully incorporated wastewater and recovery data, giving clearer insight into how these factors relate to case counts.
-
Additionally, wastewater data proved to be a valuable early indicator of COVID-19 spread, detecting asymptomatic cases that standard testing might miss.
-
An interesting side note: rainfall seemed to dilute viral RNA in wastewater, potentially affecting viral load readings and offering another environmental dimension to explore.
Curiosity
During the pandemic, I got curious about how waste water data could help predict the number of new COVID-19 cases. So I decided to build a model to forecast daily cases in British Columbia (B.C.), using data from April 1st, 2020 to August 27th, 2021.
The challenge? To Predict the number of new cases that will appear based on data from 1, 3, 5, and 7 days ago. Along the way, I explored case counts, recovery data, wastewater surveillance, and even rainfall
Here’s a breakdown of what I did
Collecting the Data
I worked with two main datasets:
-
COVID case data for B.C.
This included daily new cases, hospitalizations, ICU numbers, active cases, and wastewater readings from five sewage plants. -
Rainfall data
Pulled from weatherstats.ca, specifically for Vancouver.
The wastewater data was reported weekly, so I forward-filled it to create a daily dataset. I also created a new variable I called Adj_ww (Adjusted Wastewater), which took into account recoveries and deaths — the idea was to make it reflect the number of truly active cases better.
Feature Engineering
Some interesting things popped out while exploring correlations:
- Previous day’s active cases had a really strong correlation (0.92) with new cases the next day. That was a big signal.
- I created a
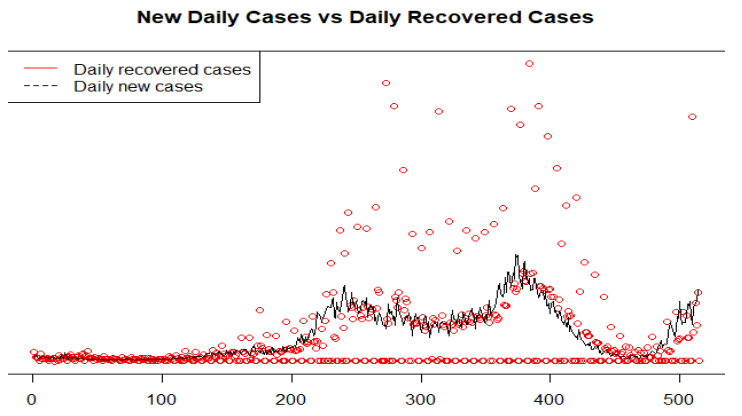
daily_recoverymetric by subtracting today’s recoveries from yesterday’s. It looked visually similar to new cases but had a lower correlation (~0.44). - The adjusted wastewater (
Adj_ww) ended up having a strong correlation (~0.8) with new cases, better than raw wastewater values.
Building the Models
Model 1: Regression
I started with an exponential regression model with the form of
In this model, I found that the number of new cases and recovered cases in the previous day were both statistically significant, while the adjusted wastewater data (adjusted for new deaths, recoveries, and known active cases) did not improve the model. Additionally, while the model did an adequate job for predicting new cases using data up to 1 day prior, the model performed rather poorly for multi-day predictions.
Next, I switched to a simple linear regression with the form of
Which incorporates the:
- Previous day’s cases
- 7-day weighted moving average
- Adjusted wastewater
The model performed decently and all the variables were statistically significant. I liked this model because it was easy to understand — great for interpreting what’s actually influencing case numbers.
Model 2: Time Series
Next, I tried a transfer function time series model, which is a kind of ARIMA model that can include external predictors (like active cases). The transfer function was in the form of
Where
- would be the random error vector for the MA part of the ARIMA
- the vector of coefficients
- is the vector of coefficients corresponding to the AR portion of the ARIMA model
- represents the vector of extra parameters that I’m including in the model
- accounting for the lag and decay effects of the covariates
While this model could be unstable in a non-stationary time series data I noticed no evidence of spurious regression, allowing me to move forward with this model which brings me to:
Although this time series model is more complicated and excludes noisy features like wastewater and recoveries, it performed slightly better in terms of accuracy (lower RMSE). That said, it was also more fragile when dealing with imperfect data.
Here’s the comparison based on my results:
| Model | RMSE |
|---|---|
| Regression | 86.24 |
| Time Series | 84.99 |
The difference was small. I ended up liking both for different reasons:
- Time Series Model: More accurate, but sensitive to noise.
- Regression Model: More robust and easier to interpret.
Does Wastewater Data Actually Help?
I was really curious about this! And the answer is: yes.
- Wastewater data (especially after my adjustments) was highly correlated with new case counts.
- Even though it wasn’t included in the time series model (because of noise), it was statistically significant in the regression model.
- I think it works because wastewater detects asymptomatic and unreported cases that testing data might miss.
Backtesting (to Avoid Data Leakage)
For each prediction window (1, 3, 5, 7 days), I made sure I wasn’t cheating by accidentally training on future data. I created different datasets where the features only included data available before the prediction date.
It was a bit manual, but I confirmed it was working by checking some specific index ranges — and everything looked good.
Does Rain Dilute Wastewater RNA?
I looked at whether rainfall affects wastewater viral load — and it does seem to.
The theory is that rainwater entering the sewer system dilutes the virus concentration. So if it rains a lot, RNA levels might appear lower even if the infection rate hasn’t changed.
I didn’t end up correcting for it in my final models, but it’s definitely something I’d like to explore further.